Verify Combine Deployment Integrity
There are a few ways to verify whether Combine is up and functioning properly.
Integrity/Infrastructure - Stack Drift Detection
This is the easiest to check for.
Simply navigate to the cloudformation console, begin a new 'Drift Detection' check:
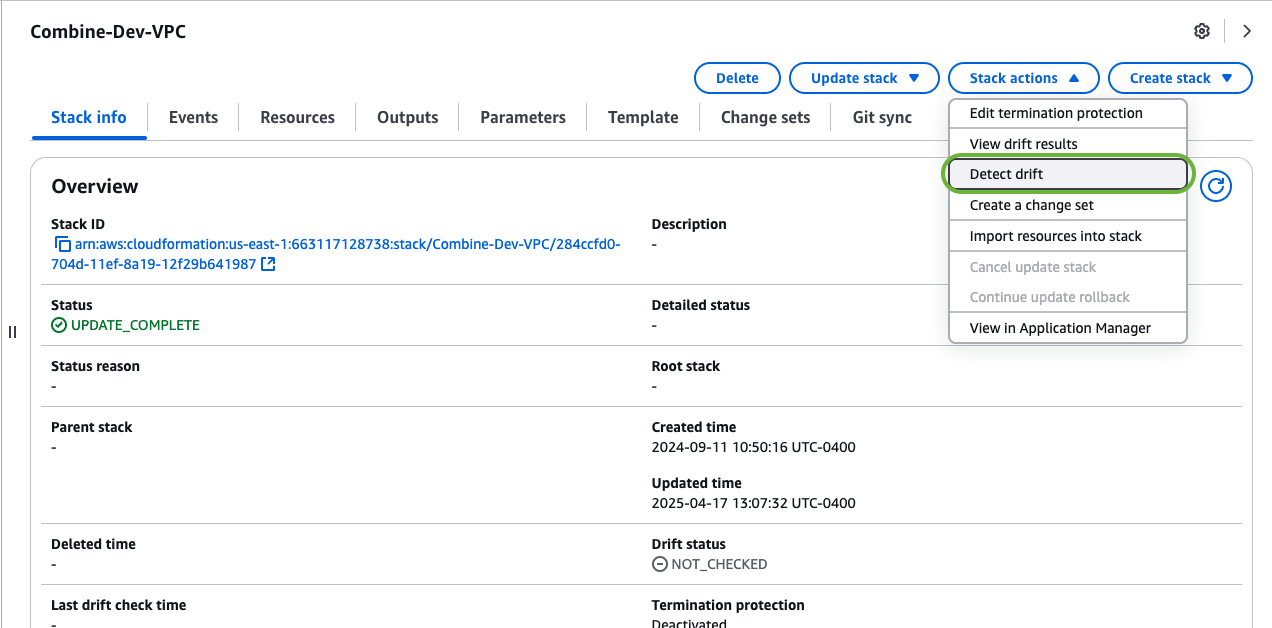
Once you initiate a Drift Detection, you'll see a blue notification at the top of the console. Once it is completed, return to the same stack and select 'View drift results':
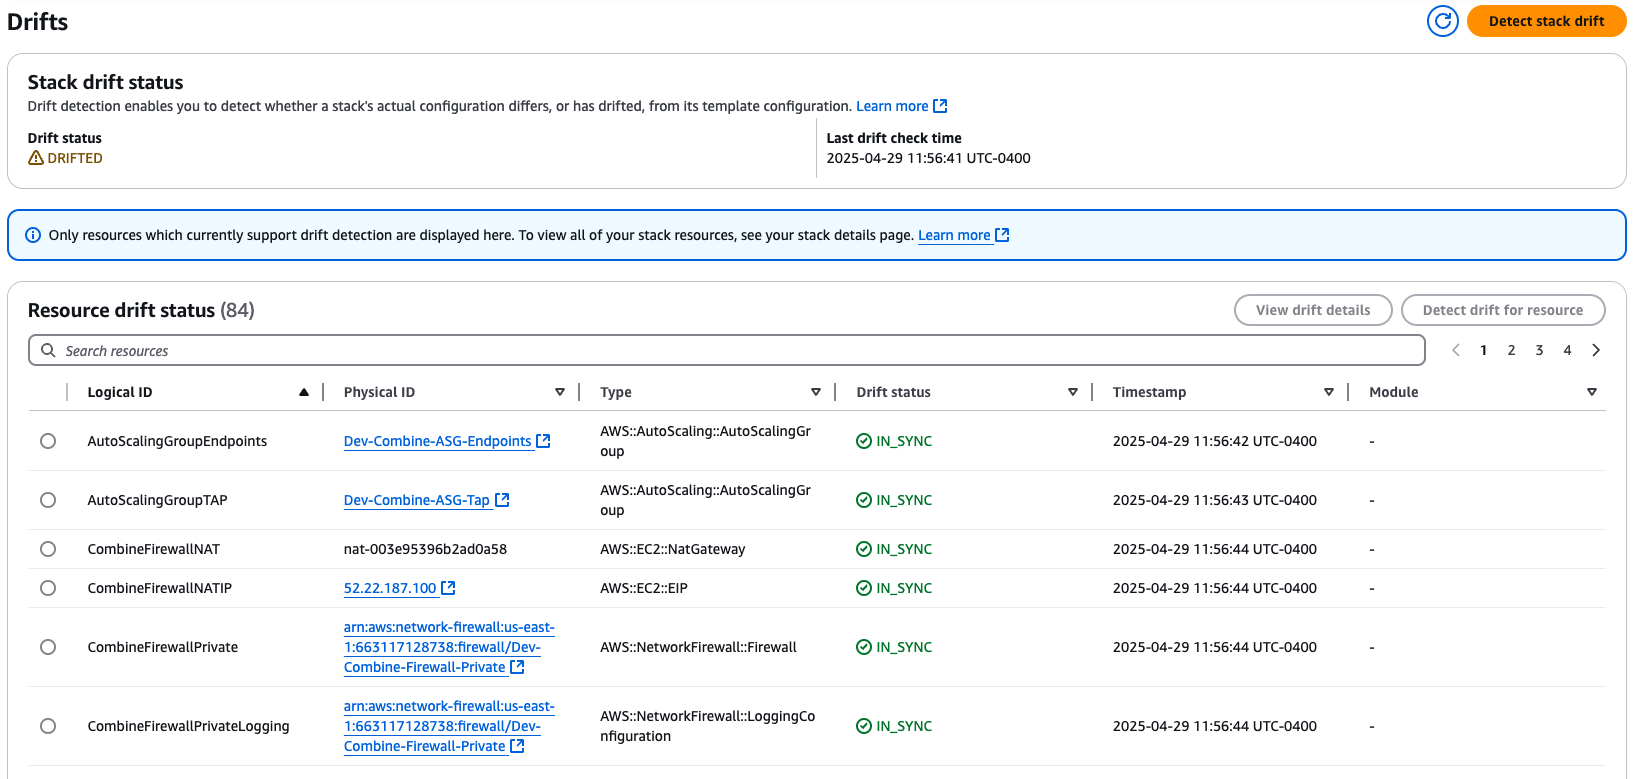
You can sort by Drift Status to see which Combine resources have been modified or deleted.
It is normal for resources like Security Groups and Network Firewall Rule Groups to be modified post-deployment.
The Combine and Combine-VPC (or similarly-named, if doing a namespaced deployment) are the most critical to check for Combine Infrastructure.
If vital Combine resources (including ASGs, Load Balancers, subnets) have been modified or deleted, Combine is in a degraded state.
Dashboard Availability
To check Dashboard aliveness, all that is necessary is to attempt to hit the Load Balancer that serves the Combine Dashbaord. If accessing the dashbaord for the first time, you'll need to install the user certificates from the credential bundle that was emailed to you.
You can find more information on how to do this, as well as the Load Balancer endpoint, in the README that came with your credential bundle.
If the dashboard comes up, then it will serve requests properly.
Endpoints Availability
The last piece of Combine functionality to check is the Endpoints Logging. The Endpoints Server is also exposed via a Load Balancer, but does not have a web interface.
An easy way to determine whether the Endpoints server is up and listening for requests is to check logging via CloudWatch Logs - any application errors are logged there.
To check Endpoints Server logs, navigate to the CloudWatch Console, look for the log group named Combine_Endpoint_Log_Group_Endpoint:
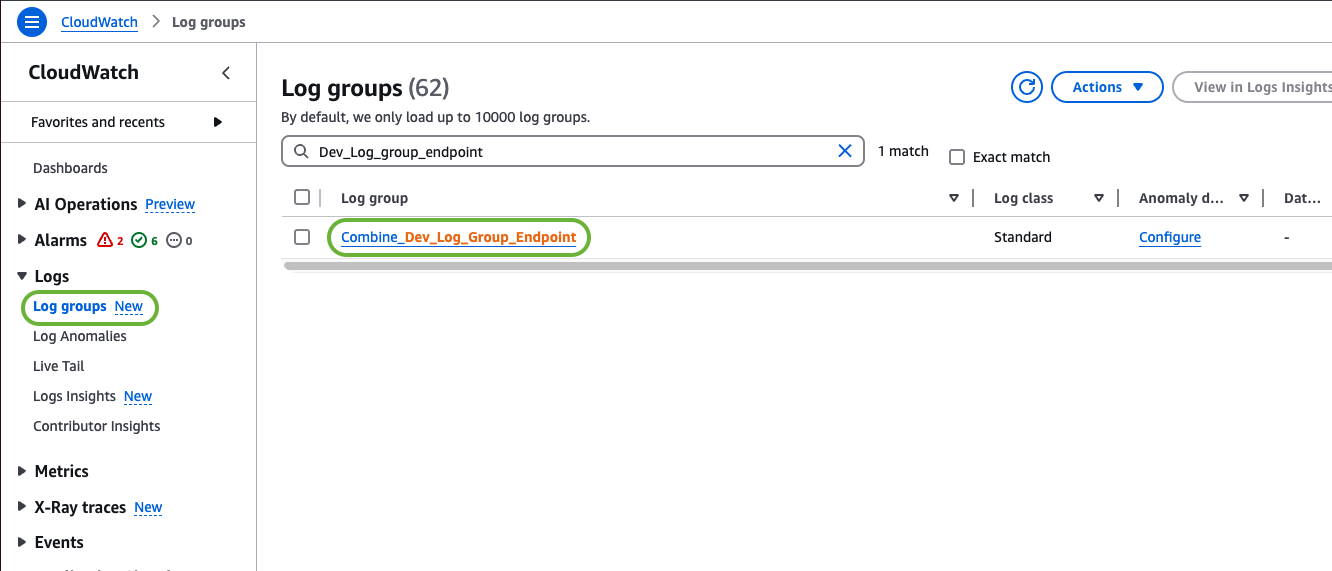
Click on the Log Group and select 'Search Log Group' on the top right.
You should see some logs that will detail things like API Request and Response Rewriters being loaded, or caches refreshing. This is good.
To check for any explicit application errors, run the following query against the log events:
{ $.errorLogCount > 0}
If you do not get any results then the Endpoints server is in a healthy state.
Note that Combine provisions health checks on the Dashboard and Endpoints servers, so unhealthy instances are re-provisioned as needed.